Creating spatial data from tabular data involves transforming descriptive information stored in a table format into geographic features with attributes, based on the x and y coordinates that correspond to the actual locations of the data on Earth.
This transformative process provides the ability to explore and understand spatial relationships and patterns, empowering in-depth analysis and visualization of the data within GIS environments or other geospatial tools.
In this post, we will explore how to create spatial data from tabular data, which includes the following:
- Manual Extraction of Data from Google Maps and Storing in an Excel Spreadsheet.
- Scraping Data from Google Maps Using Python.
- Adding Excel Tabular Data as a layer in ArcGIS Desktop.
Creating Spatial Data from Tabular Data
1) Manual Extraction of Data from Google Maps and Storing in an Excel Spreadsheet.
Let's assume that you are looking for the best geographical location to establish your new restaurant in Suez Governorate. In such a case, a spatial data layer showcasing the geographical distribution of restaurants in your specific region of interest becomes exceptionally valuable.
We will begin our process by collecting restaurant data located in Suez Governorate using Google Maps. Subsequently, we will store the aggregated data in an Excel spreadsheet.
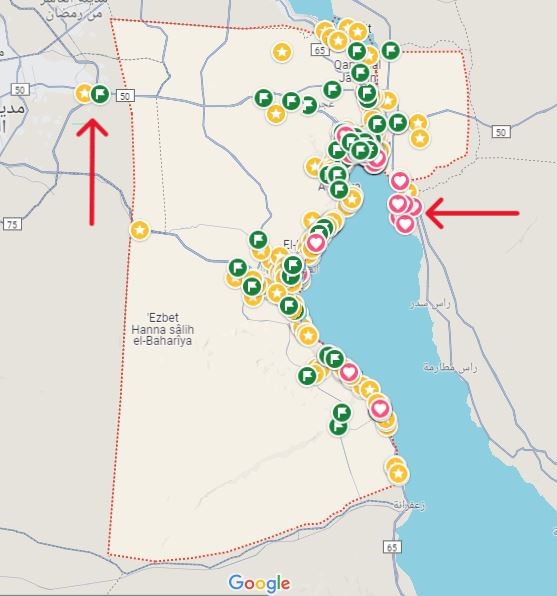
1. Start by dividing your region of interest into small zones.
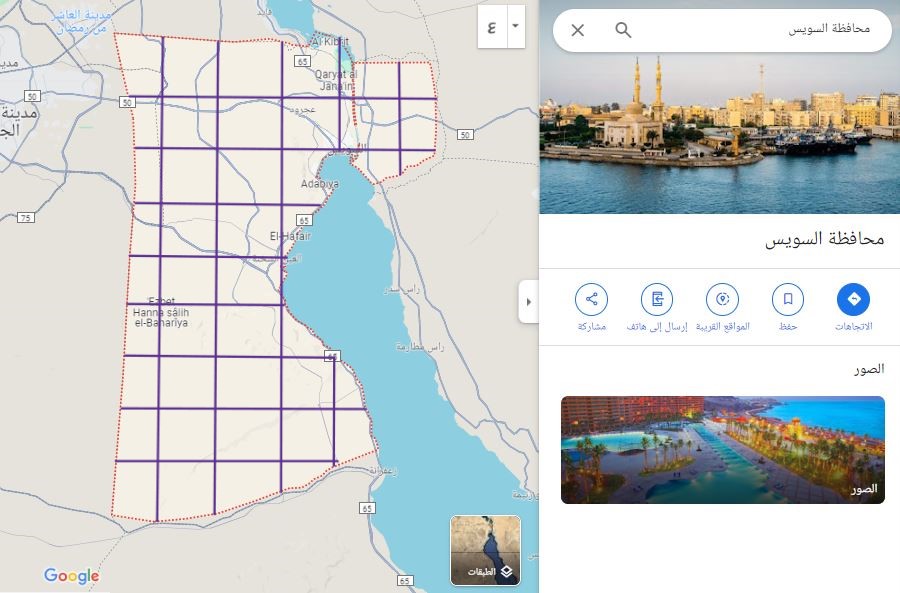
2. Zoom to every zone, one by one, and start to search for restaurants.
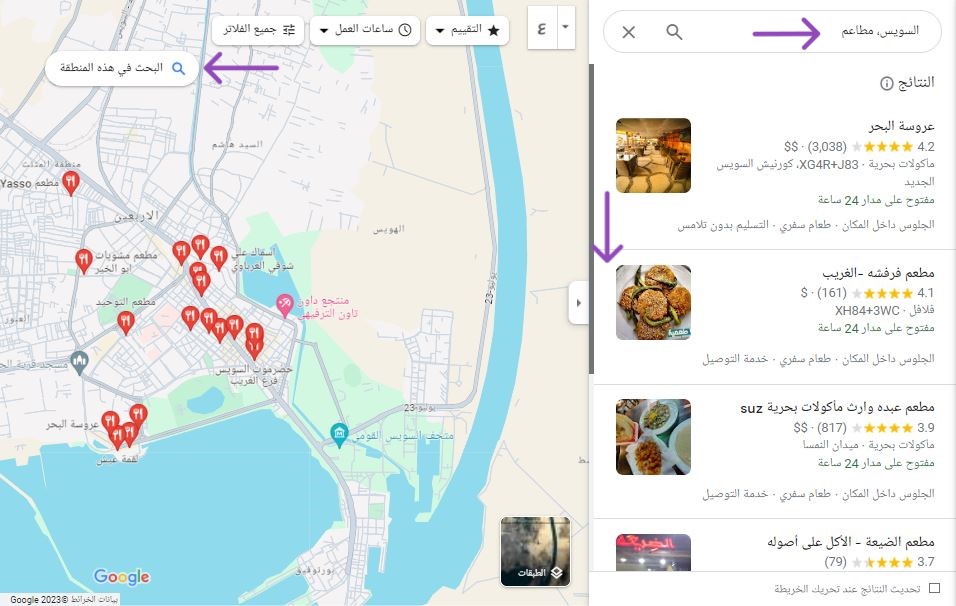
Use the left window named 'results' and scroll up and down while you're collecting restaurant data to ensure that you cover the whole area.
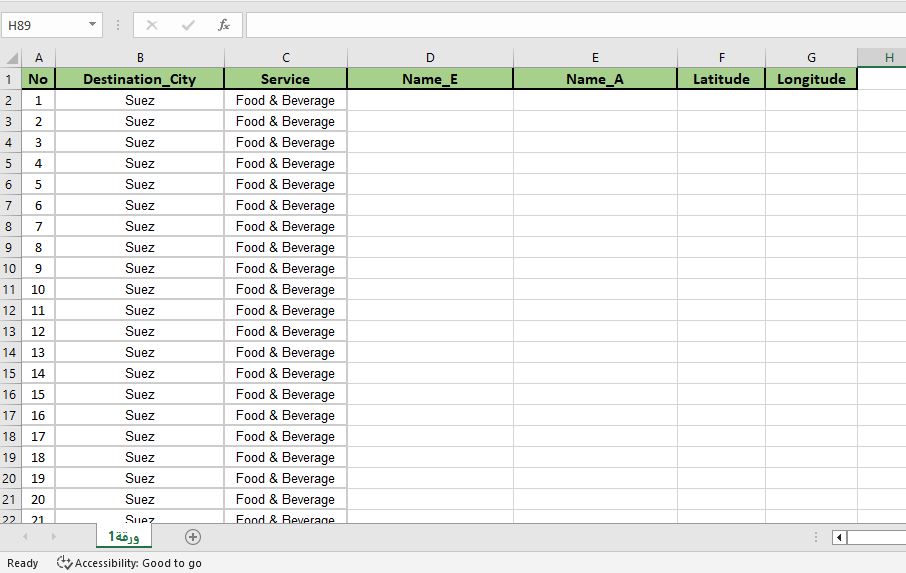
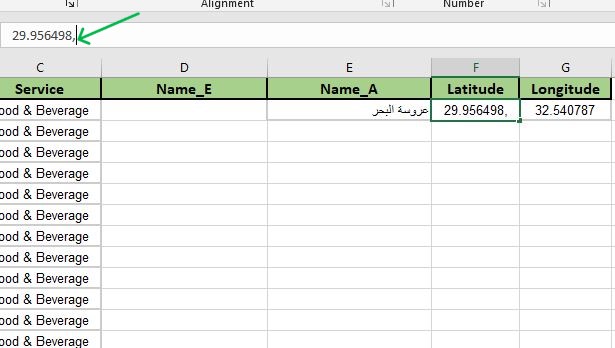
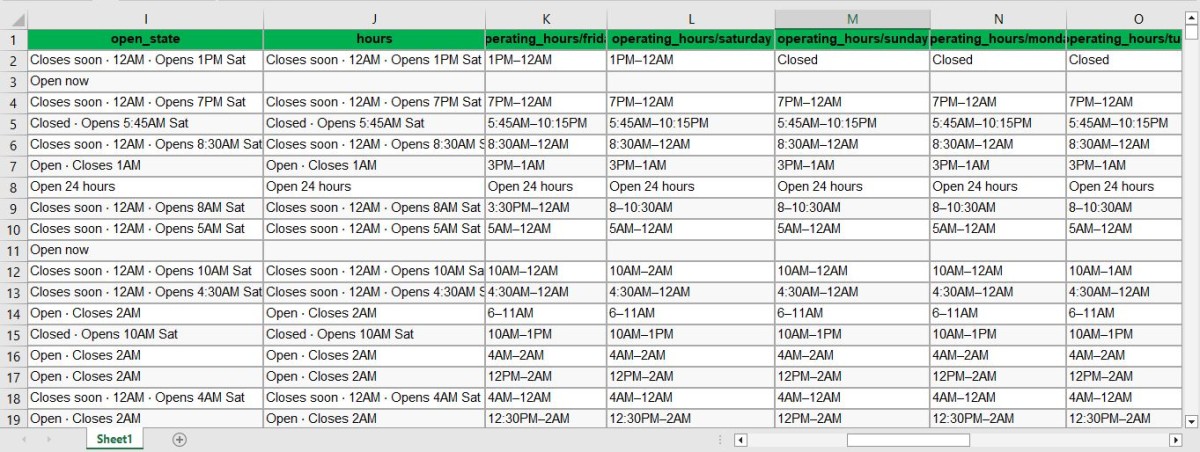
3. Design and organize your Excel spreadsheet to store the business data and XY coordinates inside it.
4. Collect all data you’re interested in.
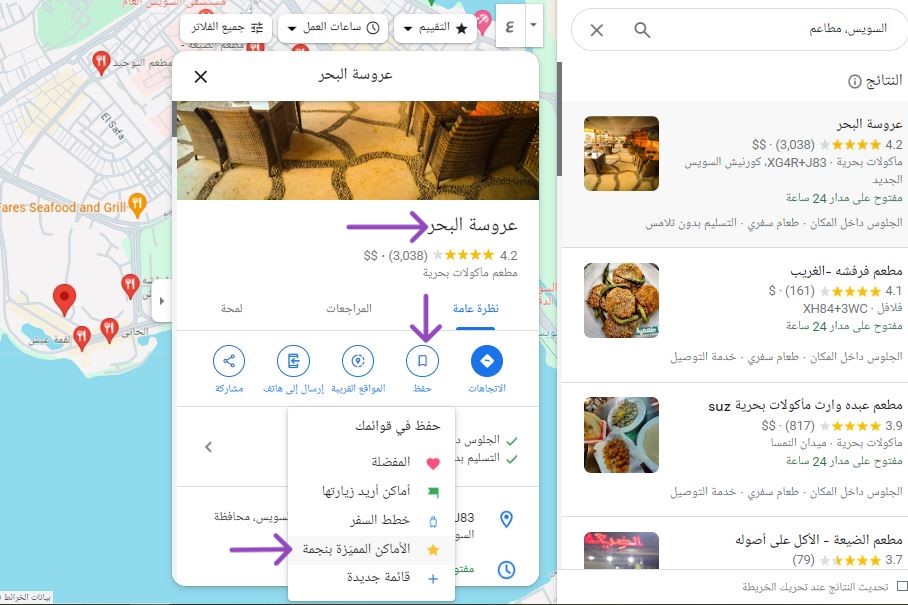
It is worth noting that you pressed 'save location with a star' to avoid collecting the data for the same location twice. It is a common mistake that leads to issues in data quality called Data Redundancy.
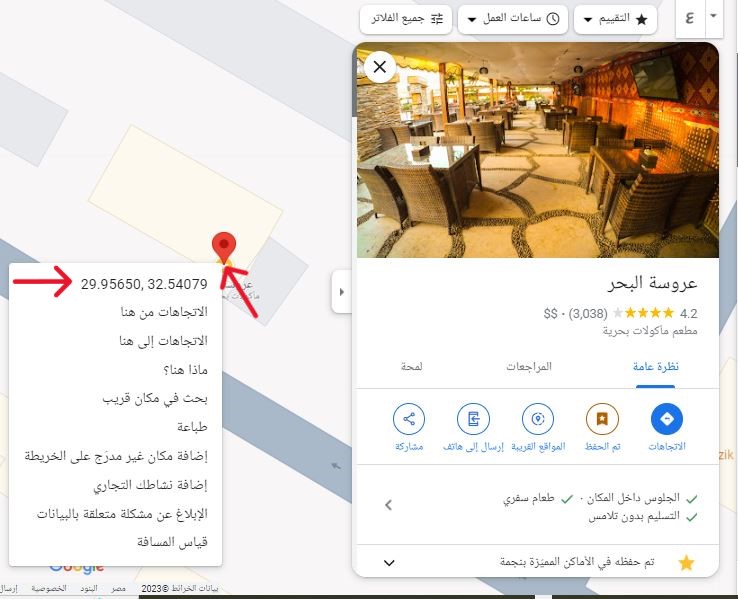
5. Zoom deeply into the restaurant location and press right-click to copy the restaurant’s XY coordinates.
6. You need to zoom into each zone in your region of interest, further zooming inside each zone itself at different locations. Press the 'search in this area' icon repeatedly while collecting your business data. Move slightly left or right, up or down, and press the icon to search for more existing restaurant locations, ensuring comprehensive coverage of all restaurant data in your region of interest. This step is crucial for ensuring Data Completeness.
7. Some tips and tricks to ensure Data Quality.
- Avoid making any textual errors, especially while you are inserting the x and y coordinates, And don't forget to delete this comma.
- Minimize Data Inconsistency.
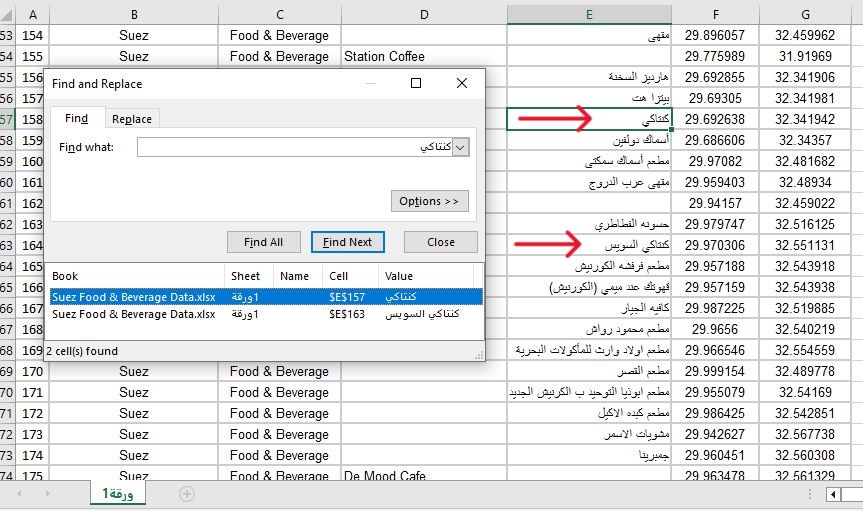
In such a case, both should have the same name because they reference one place called 'KFC'.
- Ensure Data Completeness by following the tips we mentioned in step (6).
- Minimize Data Redundancy.
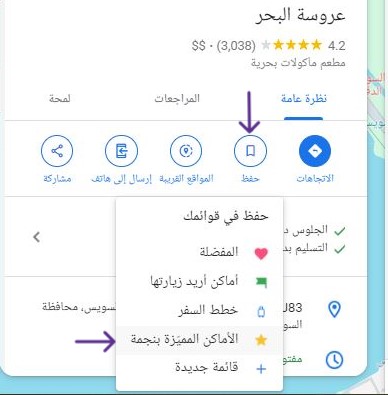
- Highlight every location's data you extract with a star to avoid collecting the same data twice, as we mentioned in step (4).
- Do not worry if you gathered data that are outside your region of interest, you can query and delete them from Excel or you can simply use the power of GIS later and clean these irrelevant data.
See Also
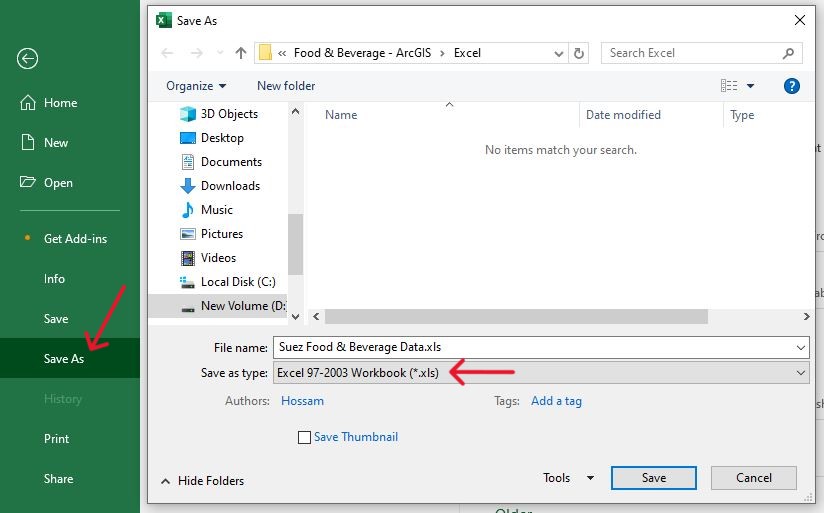
8. After completing your data extraction process and preparing a well-structured Excel spreadsheet, save your Excel table as an XLS file format.
2) Scraping Data from Google Maps Using Python
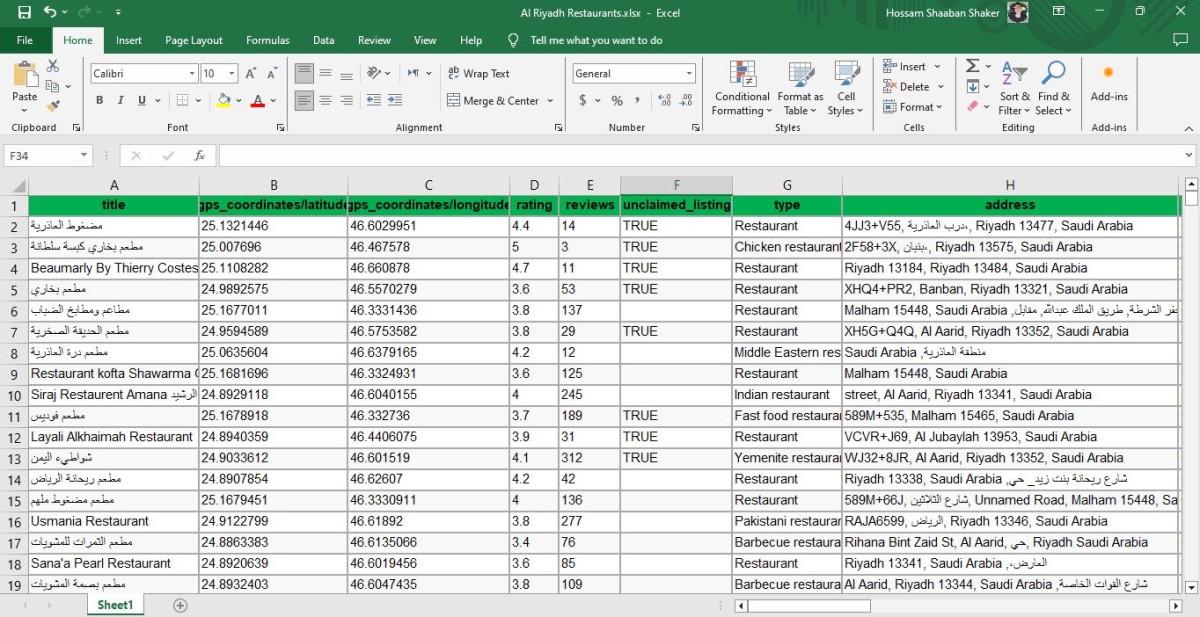
In addition to manual data extraction from Google Maps, automating the process using web scraping tools can significantly streamline data gathering. By transforming and cleansing the collected data, the output data table can be in a format like this:
We may write a Step-by-Step guide post on this topic shortly with an explaination of how to add Excel Tabular Data as a layer in ArcGIS Pro.
3) Adding Excel Tabular Data as a layer in ArcGIS Desktop
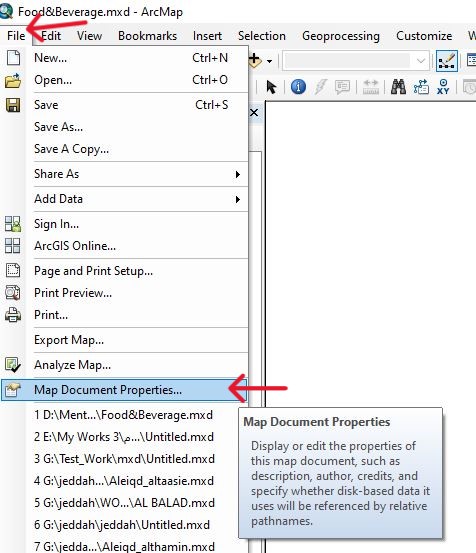
1. Start by opening ArcGIS, then go to 'File' in the main menu and press 'Map Document Properties…'
To create a Default Geodatabase, follow these steps:
- Press and highlight the 'pathnames' if desired (optional).
- Then, click on the Folder Icon to create a new folder,
- And inside the newly created folder, press the option to create a 'New File Geodatabase' and rename it as desired.
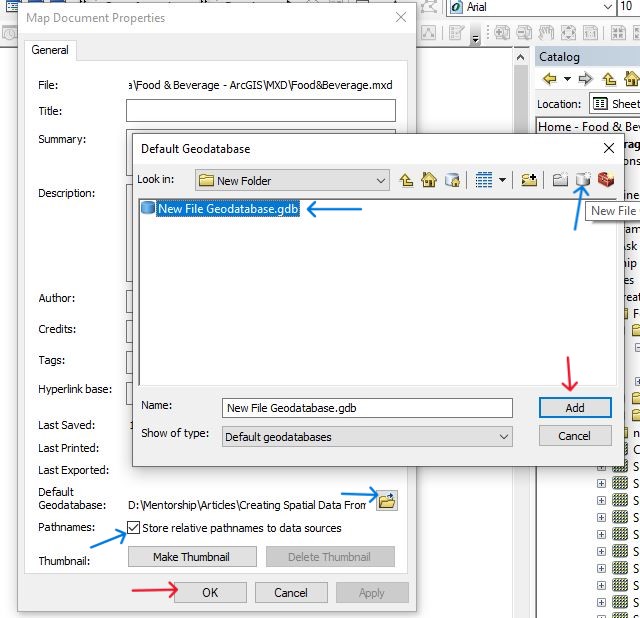
- Then, Choose the New File Geodatabase you create and 'Add' it then press 'OK'.
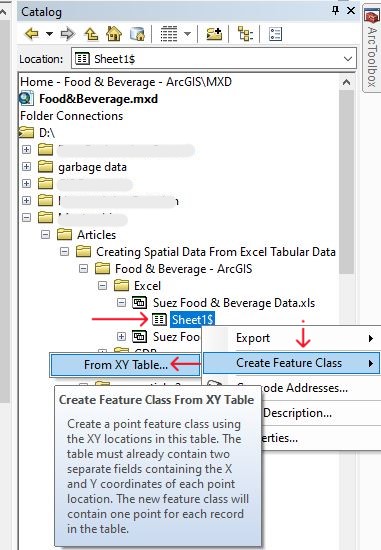
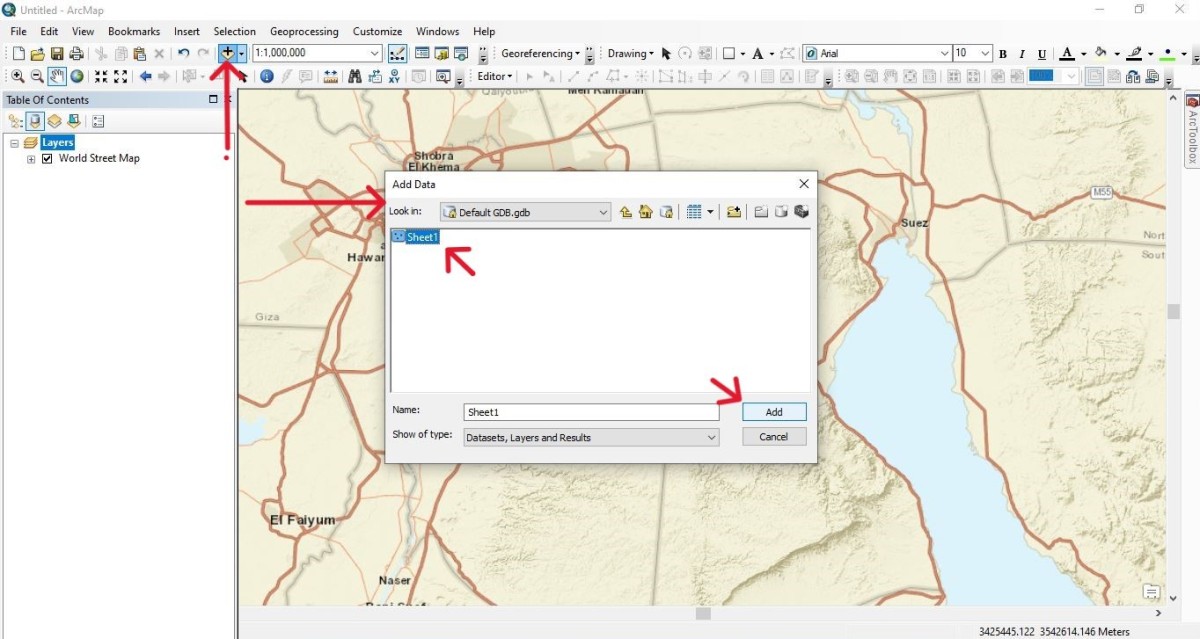
2. Open 'ArcCatalog' and move to the location where the Excel Table is stored.
3. Press right-click on the Table Sheet, and from 'Create Feature Class', Press on 'From XY Table…'
4. Make sure that the tool recognizes both X Field 'Longitude' and Y Field 'Latitude'; if it doesn't, define them yourself.
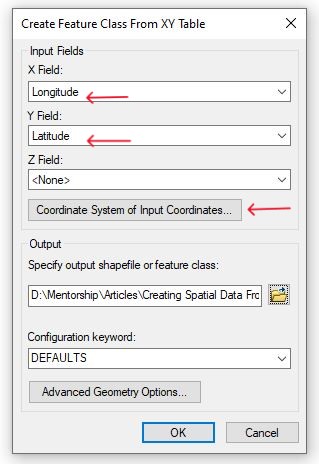
5. Click on 'Coordinate System of Input Coordinates...' to define the Coordinate system.
In my case, I will choose 'GCS_WGS_1984'.
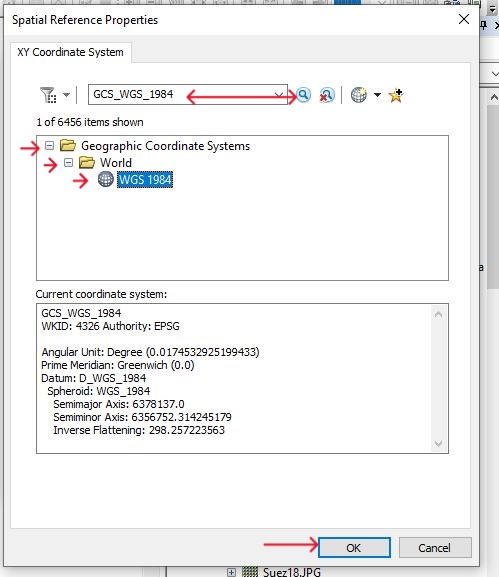
6. Click 'OK'.
7. Specify output feature class.
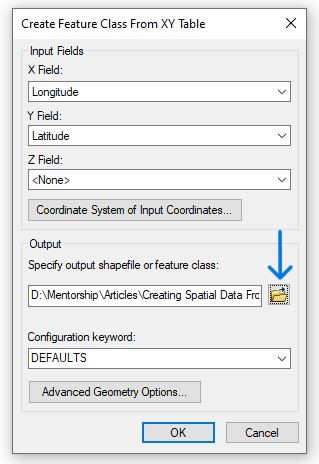
8. Use the Geodatabase we created before to store the output Feature Class inside it.
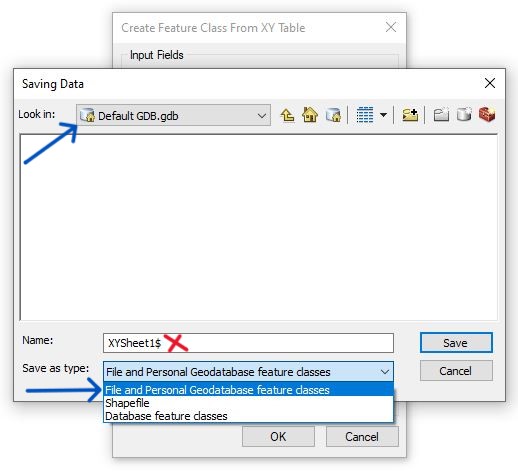
It is worth noting that the table sheet's name and the feature class's name must be identical, and You must change the name from 'XYSheet1$' to 'Sheet1' in our case.
9. Click 'Save', and Finally press 'OK'.
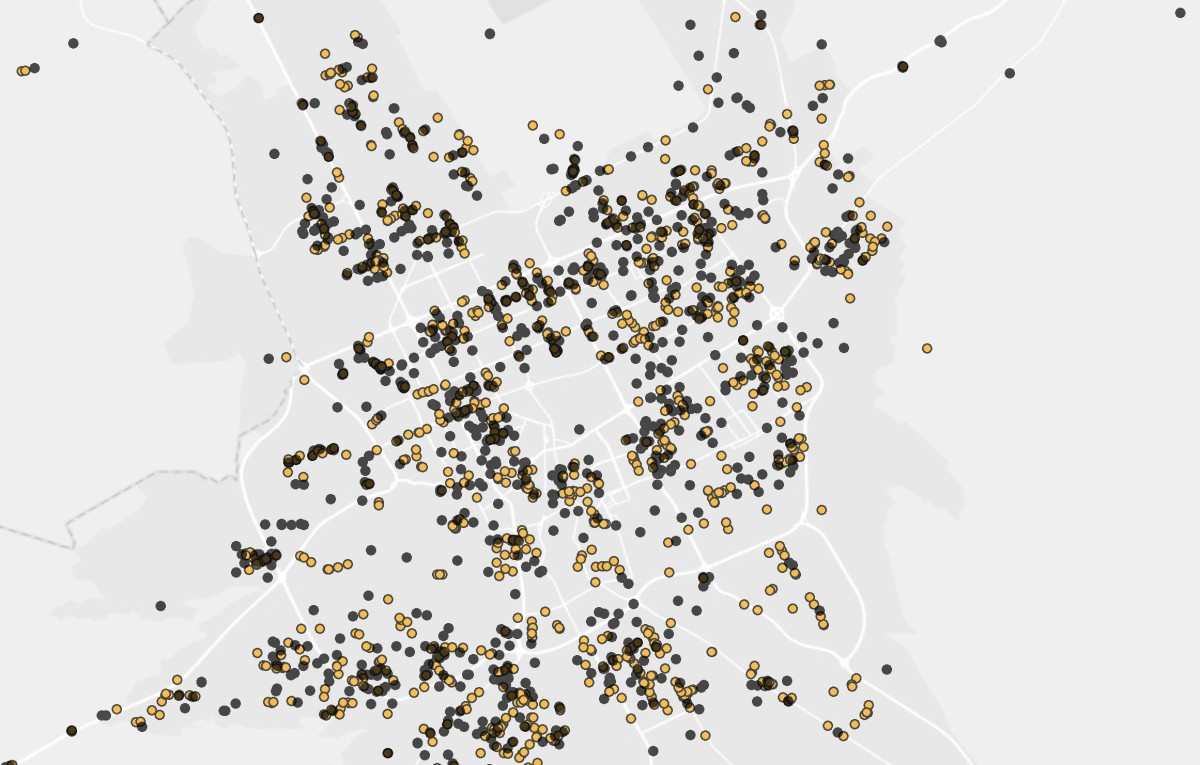
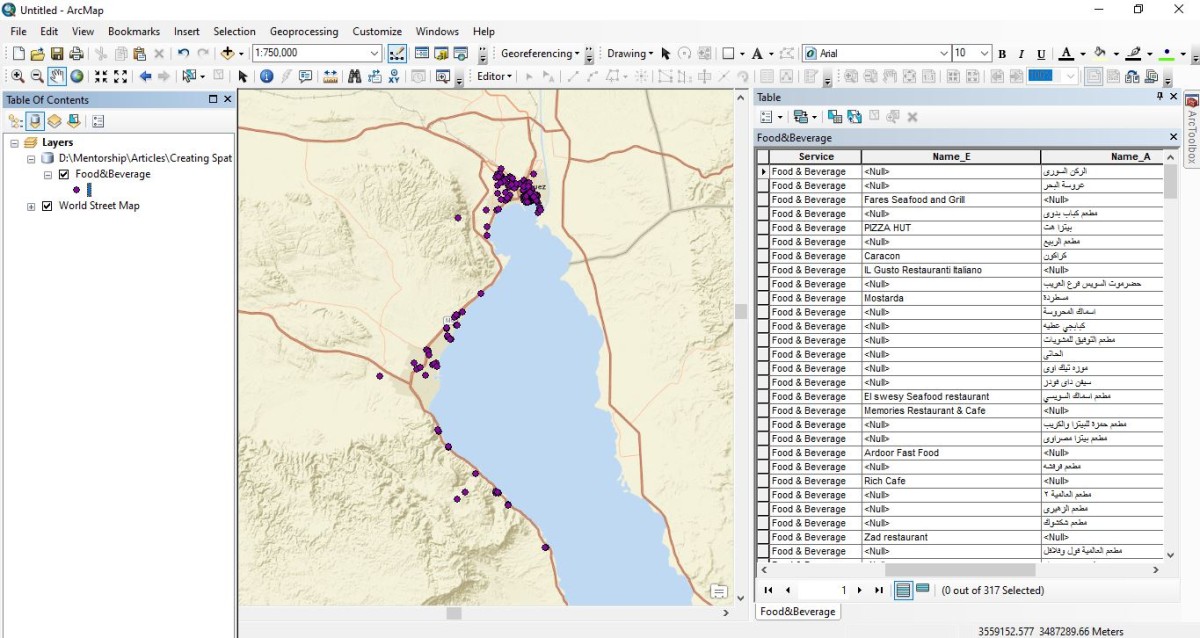
10. Add the Feature Class we created into ArcMap, and you can add a Basemap to easily validate your new spatial data layer.
Now, your Spatial data layer has been created and it is ready to be analyzed and used to accomplish your goals using the power of GIS.
Conclusion
In this detailed guide post, we explored how to extract your business data from Google Maps and store it in a well-structured Excel spreadsheet. These processes formed the foundation for transforming the tabular data into a robust spatial data layer using ArcGIS Desktop, allowing you to easily analyze and visualize it for valuable insights.
See Also