Power BI Bar Chart from Left to Right
Unfortunately, there is no option in the Bar chart visual to show the bar from left to right in Power BI.however, you can go through the following workarounds:
1 ) Show bar chart from left to right using Tabel conditional formatting
You can use this workaround to show the Power BI bar chart from Left to Right as shown below:

Steps
- Create a table.
- Add the value that would like to show as a bar chart (Y-Axis) to be the first field in your table.
- Add the x-axis field value as the second field in your table
- Remove the table header as mentioned at Remove the table column header in Power BI.
- Set the style to
None.
- Turn off the vertical grid in the grid section.
- Turn off Totals in the
Total section.
- In the
Field formatting, align the Y-Axis field to the Left.
- Turn off Title, Visual header, Border.
- Turn on the Tooltip.
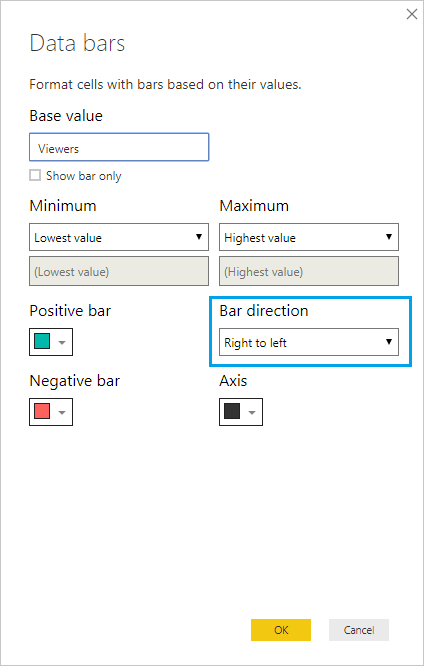
- In the conditional formatting, enable Data Bar, and click on the Advanced Settings to set the bar direction from Right to Left as shown below:

One of the main cons of this workaround is you can't change the bar color for each value.
2 ) Show bar chart from left to right using Y-Axis concatenation
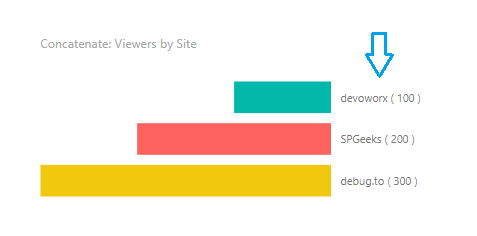
You can also use this workaround to show the Power BI bar chart from Left to Right as shown below:

Steps
First, you should create a measure to multiply the Y-Axis to -1 as shown below
LTRBarMeasure = sum(Sites[Viewers]) * -1
Again, create a new calculated column to concatenate the X-Axis with Y-Axis
Sites with value = FIRSTNONBLANK(Sites[Site],true()) & " ( " & FIRSTNONBLANK(Sites[Viewers],true()) & " )"
- Add the measure in values.
- Add the column in Axis.
- Turn off the data label.
- Turn off tooltip.
One of the main cons of this workaround is you should disable data label and tooltip to avoid showing the value in Minus.
3 ) Show bar chart from left to right using Cards
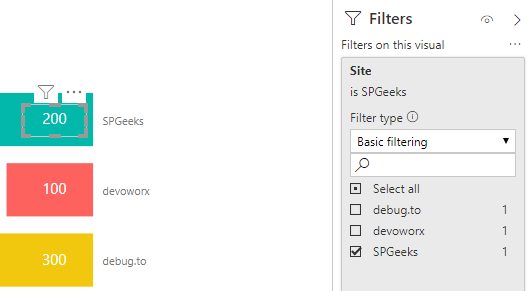
Besides the above workarounds, you can also use this workaround to show the Power BI bar chart from Left to Right as shown below:

Steps
First, you should create a measure to multiply the Y-Axis to -1 as shown below
LTRBarMeasure = sum(Sites[Viewers]) * -1
- Add the measure in values.
- Add the column in Axis.
- Turn off the data label.
- Turn off tooltip.
- Sort your chart Axis to make it static.
- Create a card for each Axis value filter by each Axis value.

This solution is only suitable if you have static Axis values, and you may find some difficulties to adjust the card position for each bar. Moreover, you should turn off the data label and tooltip
4 ) Show bar chart from left to right using Multi Axes Chart
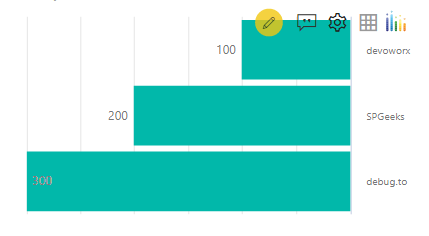
You can also use a paid Multi Axes Chart to show the Power BI bar chart from Left to Right as shown below:

Steps
- Download Multi Axes Chart
- Import the download chart in your visuals.
- Set the X-Axis and Y-Axis.
- In the Y-Axis, turn on the
Reverse Axis.
Download