In this post, we're gonna explore the Visuals in Power BI.
Data visualization
- Data visualization means placing data in a visual context to help people understand it such as representing data in charts and graphs.
- You'll find visuals in reports, dashboards, and Q&A that are packaged with Power BI.
- It is important in case of big data.
- BI reporting tool is the most common tool of data visualization tools.
- Users can set up visualization tools to generate automatic dashboards.
Visuals in Power BI.
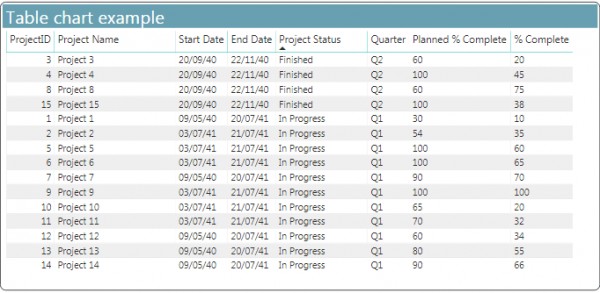
Table
There are two visuals in Power BI that used to visualize tabular data one is Table and the other is Matrix.
The table is a grid of rows and column that contains related information and it might have headers and a line for sum "total".
Use
- when you will deal with related information that can be listed in columns.
- to compare detailed data and exact values
- to display data in a tabular format
- to display numerical data by categories.
Example
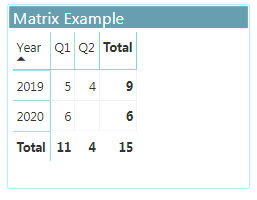
Matrix
Matrix visual is a type of table visual.
- The matrix in power BI is similar to the table and it also called across tab.
- Matrix display data across multiple dimensions.
- Matrix aggregate the data and enable drill down.
Use
- Use the matrix when you want to display the relationship between two or more than two groups.
Example
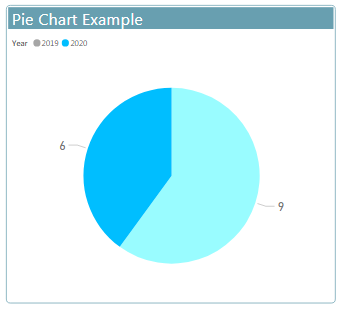
Pie charts
Pie charts show the relationship of parts to a whole.
- Pie Chart can be defined as a circular chart with multiple divisions in it and each division represents some portion of a total circle or total value.
- Simply each circle represents the total value of 100 percent and each division contributes some percent to the total.
- enables you to work with a huge volume of data.
Use
- Use Pie charts when you want to visualize the high-level data.
Example
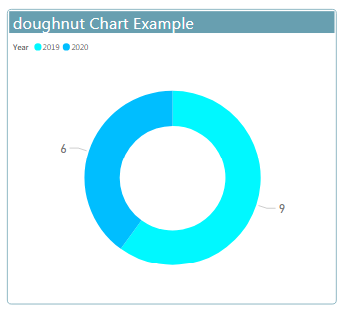
Doughnut charts
- Doughnut charts are similar to pie charts.
- Information that can be listed in columns can be plotted in a doughnut chart.
- doughnut chart show information in rings.
Use
Use doughnut charts to show the relationship of parts to a whole and you can put label or an icon in the center space.
Example
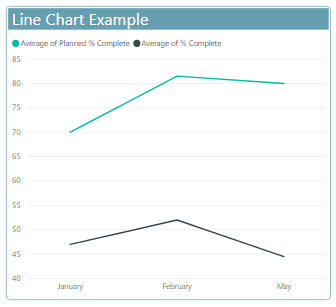
Line charts
- Line chart is some of data points that connected together in a line each point refer to data value.
- Line chart is a graph in which we take measure along one axis and dimension along another.
- Line charts emphasize the overall shape of an entire series of values, usually over time
- Line charts have one or many lines.
Use
use line chart when you want to track the changes over the time.
Example
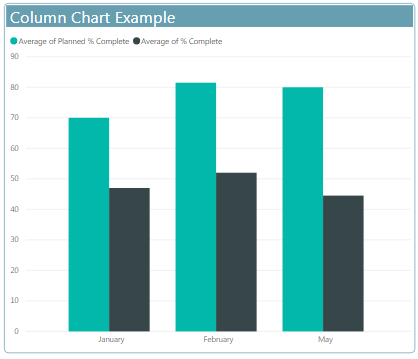
Column charts
- Show data in a rectangle bars that are easy to use and understand.
- Column chart has X-axis and Y-axis
- Usually, X-axis represents year, periods, names etc… and Y-axis represents numerical values.
Use
mostly used when you want to display and compare discrete data that can be categorized
Example
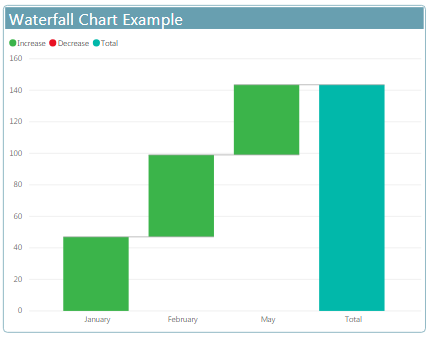
Waterfall charts
In general it’s a kind of column chart that used to show data from increasing or decreasing order from starting point throw the series of change.
Use
Waterfall charts are a great choice:
- When you have changes for the measure across time or across different categories
- To audit the major changes contributing to the total value.
Example
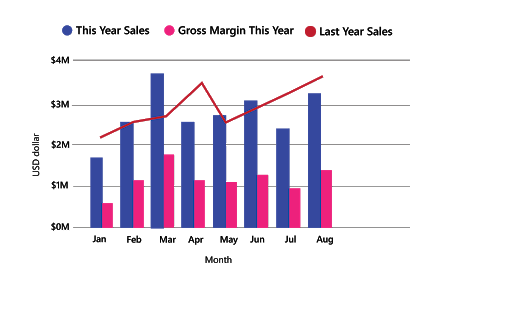
Combo charts
- Combo mean combination of two graphs on the same chart to make it more visually and understandable.
- A combo chart combines a column chart and a line chart this enable you to make quickly comparison of data, it can have one or two Y axes .
Use
- When the X axis of a line chart and a column chart is the same .
- To compare and find find the relation between multiple measures with different value ranges
- To check whether one measure meet the target which is defined by another measure
Example
ards
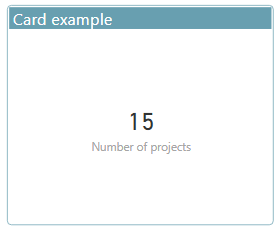
Cards: Single number
Single number cards display a single fact, a single data point. Such as ”total of something”.
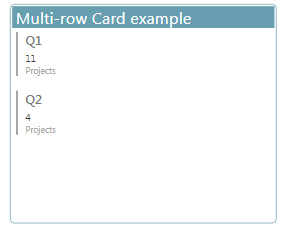
Cards: Multi row
Multi row cards display one or more data points, one per row.
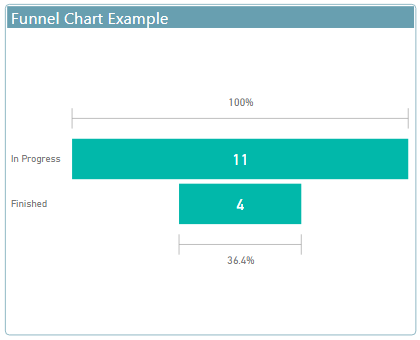
Funnel charts
- Funnels name come from its shape.
- visualize a process that has stages.
- items flow sequentially from one stage to the next.
use
use to track data process and when data is passes from one stage to another
Example
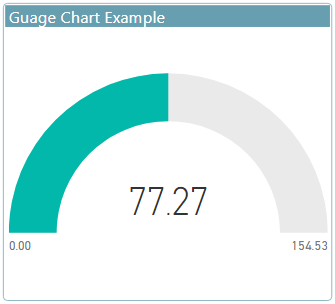
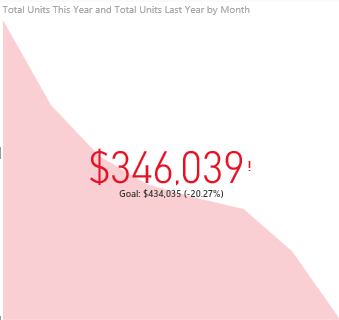
Gauge charts
- A radial gauge chart called also Dial Charts.
- It show the minimum, maximum and the current value that show you when you stand.
- It has a circular arc and displays a single value that measures progress toward a goal/KPI that is shown in bold inside the arc.
Use
Radial gauges are a great choice to:
- Show a single value within a given scale" Show progress toward a goal".
- Compare Values..
- Represent a percentile measure, like a KPI.
- Display information that can be quickly scanned and understood.
Example
KPIs
- KPI (Key Performance Indicators) are those parameters that help us to analyze the data.
- It s a visual that communicates the amount of progress made toward a measurable goal.
- These KPIs become measurement points as well and help us in tracking the business
- We actually see, what target we have fixed and what actual figures we are getting on charts with the KPIs.
Use
KPIs are a great choice:
- To measure progress.
- To measure distance to a goal.
Example
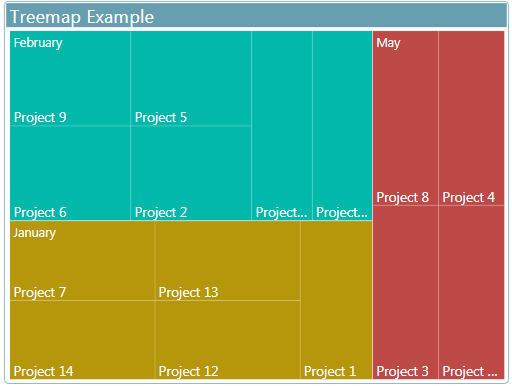
Tree Maps
- Tree maps are charts of colored rectangles, with size representing value
- used to display huge amount of hierarchical data, with rectangles nested within the main rectangles.
Use
Tree maps are a great choice:
- To display large amounts of hierarchical data "its alternative way of hierarchical structure the data that represent in branches and nested branches are represented in rectangles and nested rectangles".
- To handle a very large number of values.
- To show high level summery of different categories.
- when your data can be organized at different levels as it support the drill down feature.
- To show attributes using size and color coding.
Example
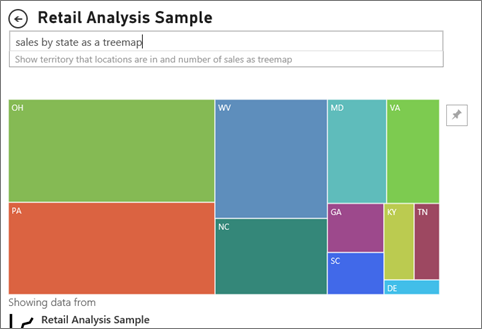
Q&A
When typing natural language queries with Power BI Q&A, you can specify the visual type in your query. For example: "sales by state as a treemap"
Example
Conclusion
In this article we learned about the different visuals in Power BI and when we use each visual in its correct place
You might also like to read