Show All detailed labels of Pie Chart in Power BI
Actually, showing detailed labels of Pie chart or donut chart mainly depends on
- The represented data in the value and detail axis.
- The size of the chart visual.
Below are my tries on my side, in order to investigate the behavior of showing the detail label of Pie chart in Power BI.
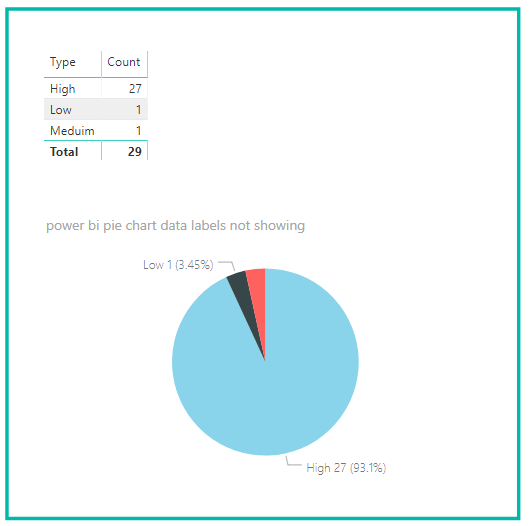
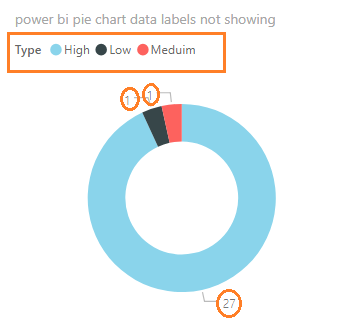
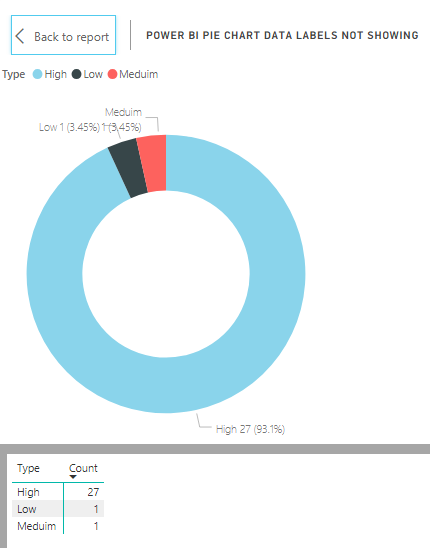
Case 1:
In this case, Although I have a Pie chart that shows only 3 values with sufficient size, the pie chart detail label is not showing for some items!
Actually, this normally happens if the data value is approximately the same (Low =1 and Meduim= 1). therefore, one of them will be only shown!
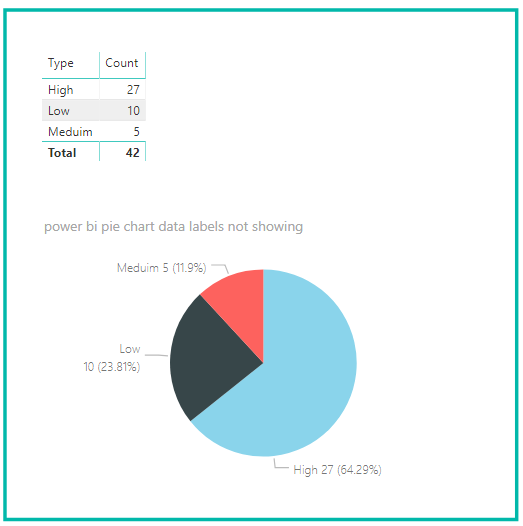
Case 2:
In this case, I'm using the same visual size and the same settings for detailed labels like fonts, position ..etc,
But when the data changed and the data value is NOT approximately the same (Low =10 and Meduim= 5) the detail labels of the pie chart are showing as expected!
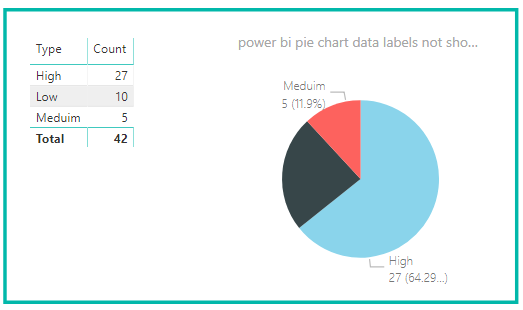
Case 3:
In this case, I tried to decrease the visual size that leads to disappearing some of the detailed labels based on the visual size!
Workarounds to Show All detailed labels of Pie Chart in Power BI
As per the above three cases, I approved that showing detail labels of pie chart in power bi mainly depends on the displayed data and the chart visual size.
Therefore, it's by design, you can't control the displaying of the detailed labels of the Pie chart and Donut chart as well!
However, I'll list some of the workarounds and the effective guidelines to show All data labels of Pie Chart in Power BI.
- Adjust Font Size.
- Increase Visual Size.
- Show Legend and only data value.
- Adjust Label Position.
- Enlarge the chart to show data
- Use a bar chart instead.
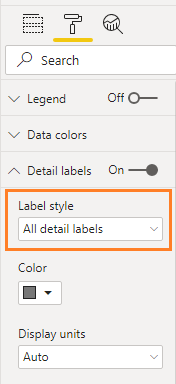
(1) Adjust Font Size
Try to decrease the font size of the detailed label may help in some cases!
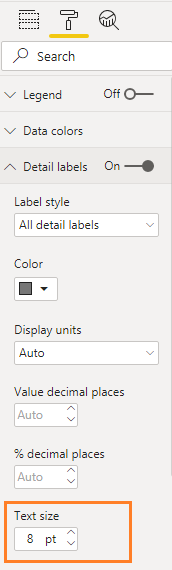
The Minimum supported font size is 8px
(2) Increase Visual Size
Increasing the visual size would help if you know how many items you would to show in the pie chart. otherwise, it's a useless option.
You should be aware of the pie and donut chart is suitable to show 2 or 3 values.
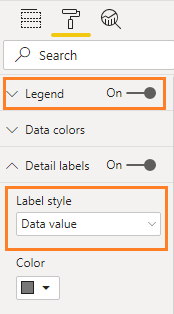
(3) Show Legend and only data value
To avoid the long detailed label: you should I
- Show only data value.
- Enable the legend.
(5) Adjust Label Position
Although you are showing only the data value, and maybe all labels not shown as you expect, in this case, try to
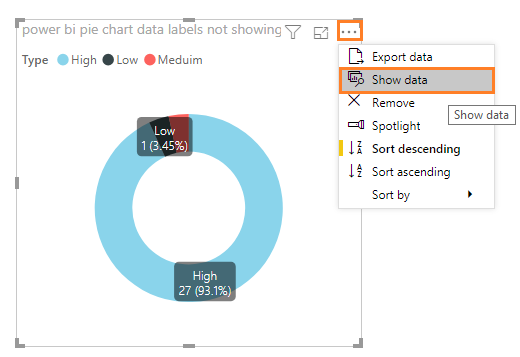
(5) Enlarge the chart to show data
You can also use the OOTB "Show Data" option to enlarge the pie chart. but this requires to enable the visual header option.
(6) Use bar chart instead
As we earlier mentioned, the Pie and donut chart is suitable to display 2 or 3 values, and If you have more than 3 values, it would be preferred to use other charts like a bar chart!
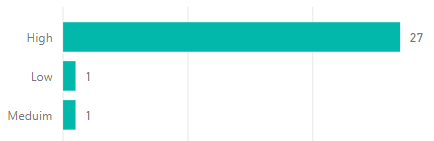
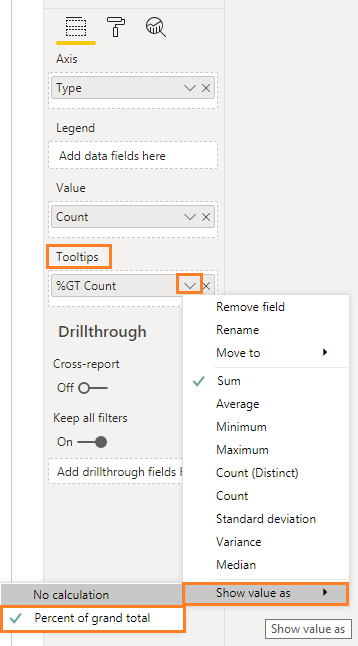
But in Pie chart, it calculates by default the percentage of the total, and this is not available in the bar chart. in this case, as a workaround, you can show the percent of a grand total in the tooltip as shown below:
You might also like to read